
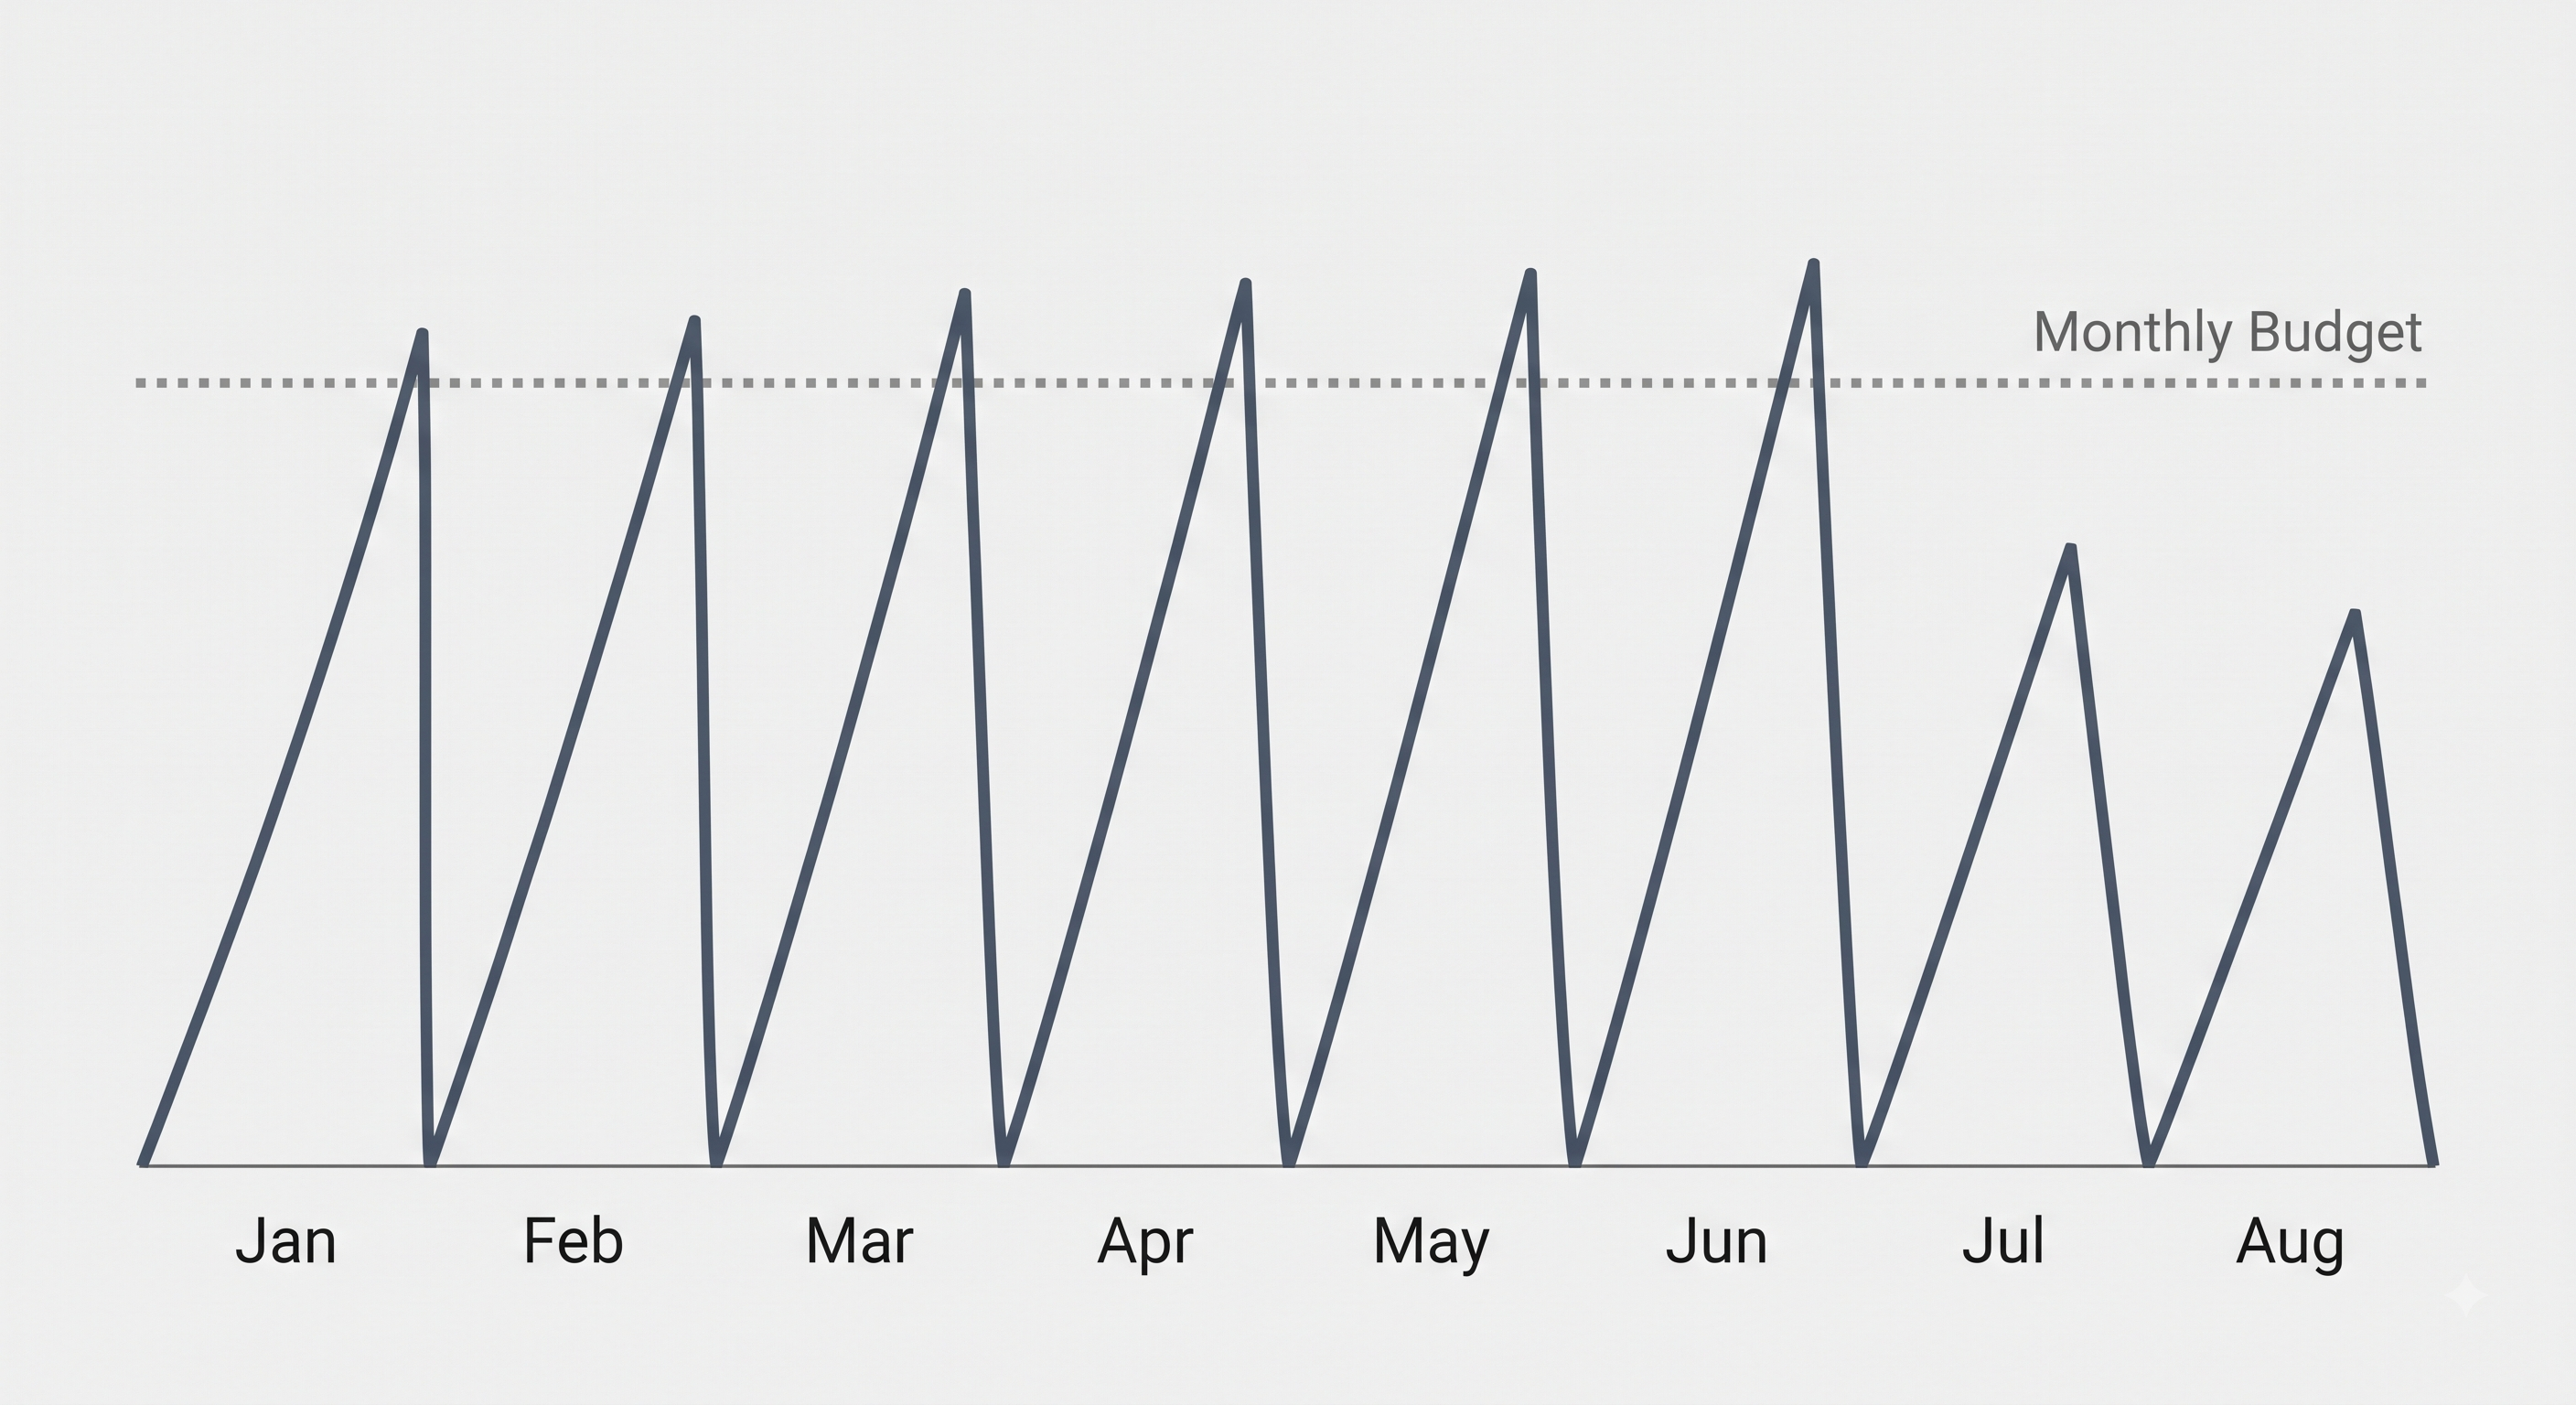
I built an internal tool this year to track what our projects cost and what they earn. Going in, I assumed the reporting logic was where the trouble would be. That’s the part with the math in it. That’s the part I’d have flagged in a code review.
The math was fine. It behaved from the first week.
What actually fooled me ran for six months, and it wasn’t a bug.
Two reports that couldn’t both be right
I found it sideways. I was in a different view, looking at overall margin across every project, and one of our support projects was sitting far below where it should have been.
That didn’t square. I’d been checking that project’s budget month after month and it had never once shown as over. A project that never goes over budget doesn’t quietly turn in a margin like that. One of those two numbers had to be wrong.
Neither was.
The number was always right
Our support projects run on a monthly budget. Clean slate on the first. A client buys a block of time for the month, we work against it, next month starts over. That made sense when we set it up and it still does.
Here’s what I didn’t think through. If costs ran hot in the last week of a month, the budget reset before I got around to looking. I’d open the view, see a small number against a full budget, and move on. The spike was real. The hours were logged. The costs were accurate. It had just already rolled into a fresh zero by the time I was paying attention.
Six months of that. Some months barely over. Some months we were losing money on the work.
Nothing in the tool was wrong. I was reading a view that reset faster than my own habits, and I trusted it because it looked clean.
Clean isn’t the same as true
A dashboard showing you a problem looks messy. A dashboard that has already forgotten the problem looks great. If you check in every few weeks, those two are indistinguishable.
And I built the thing. I knew exactly how the reset worked, because I wrote it. Knowing how it worked and noticing what it hid turned out to be completely different.
The fix was a pace check
Not smarter math. Not a new rule about budgets.
What was missing was progress against the month. If we’re 45% through the month and 75% through the budget, nothing is over. Technically everything is fine. But it’s going to be over, and that is knowable two weeks before it happens.
That’s an alert now. It fires while there’s still a month left to do something about it, which is the only version of that information that’s worth anything.
Where this leaves me
The lesson isn’t new. Instrument the thing, watch it while it’s happening, don’t trust a clean number you haven’t questioned. I’ve known that for twenty five years and I still walked into it.
What I didn’t expect is that the automation cut both ways. Pulling all of this together automatically is what let a monthly view bury an overrun for half a year. It’s also the only reason I could look across every project at once and catch the number that didn’t add up. Same plumbing, opposite result. What changed was the question I asked it.
So the thing I ask about a dashboard now isn’t whether the numbers are right. It’s what this view forgets, and how fast.